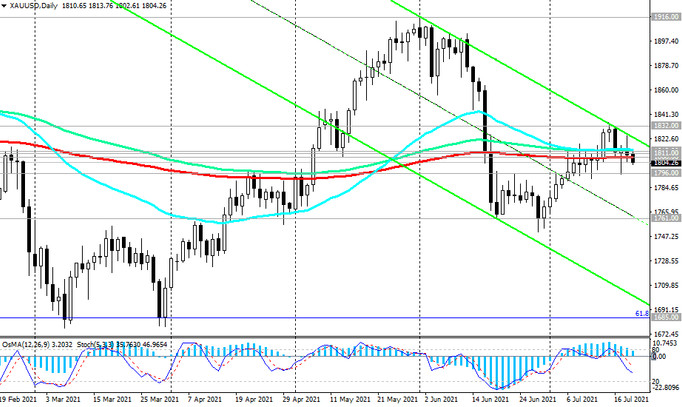
As we noted above, XAU / USD has been trading in a narrow range for several days in a row near the long-term key support / resistance level 1808.00 (ЕМА200 on the daily chart).
The pair needs new drivers to move in one direction or another.
A breakdown of the local support level and EMA50 on the weekly chart 1796.00 can provoke a decline towards the lower boundary of the ascending channel on the weekly chart at 1761.00 with the prospect of a deeper decline to the support level 1685.00 (61.8% Fibonacci level of the correction to the growth wave since November 2015 and marks 1050.00).
In an alternative scenario and after the breakdown of the local resistance level 1832.00, XAU / USD will strengthen the upward trend. Against the backdrop of rising inflation and maintaining the neutral position of the Fed, the XAU / USD pair has the potential for further growth. In this case, the targets will be the marks 1916.00, 1963.00, 1976.00 (local highs), 2000.00.

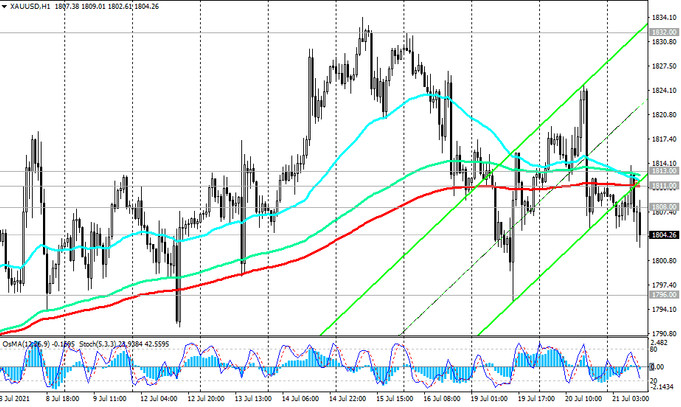
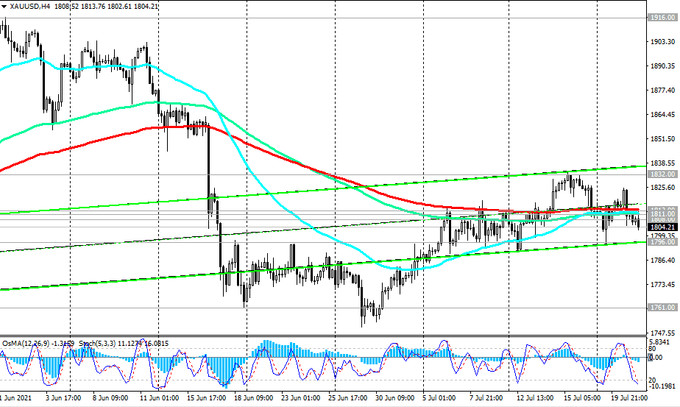
A signal for the implementation of this scenario can be a breakdown of resistance levels 1813.00 (ЕМА200 on the 4-hour chart), 1811.00 (ЕМА144 on the daily chart).
Support levels: 1796.00, 1761.00, 1685.00, 1654.00, 1586.00, 1560.00
Resistance levels: 1808.00, 1811.00, 1813.00, 1832.00, 1900.00, 1916.00, 1963.00, 1976.00, 2000.00, 2010.00
Trading recommendations
Sell Stop 1790.00. Stop-Loss 1815.00. Take-Profit 1761.00, 1685.00, 1654.00, 1586.00, 1560.00
Buy Stop 1815.00. Stop-Loss 1790.00. Take-Profit 1832.00, 1900.00, 1916.00, 1963.00, 1976.00, 2000.00, 2010.00