
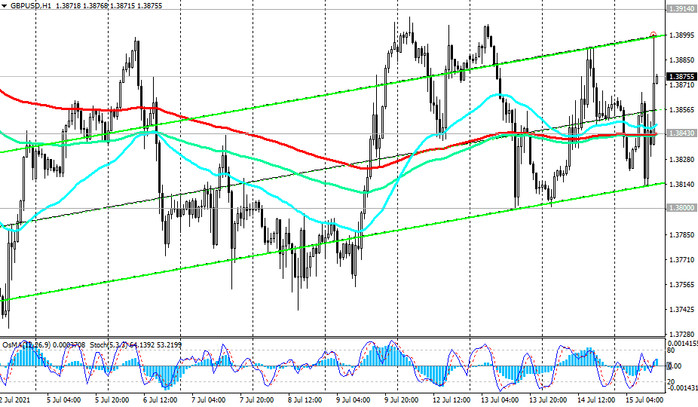
Since the beginning of July, GBP / USD has been trading mainly in the range between 1.3800 (EMA144 on the daily chart) and 1.3914 (EMA200 on the 4-hour chart) levels.
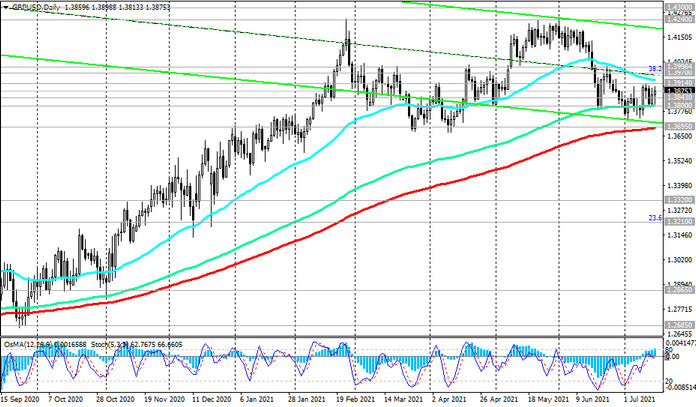
At the same time, despite a fairly strong correctional decline observed in June, GBP / USD still maintains positive long-term dynamics, trading in the zone above the long-term support levels 1.3800, 1.3695 (ЕМА200 on the daily chart).
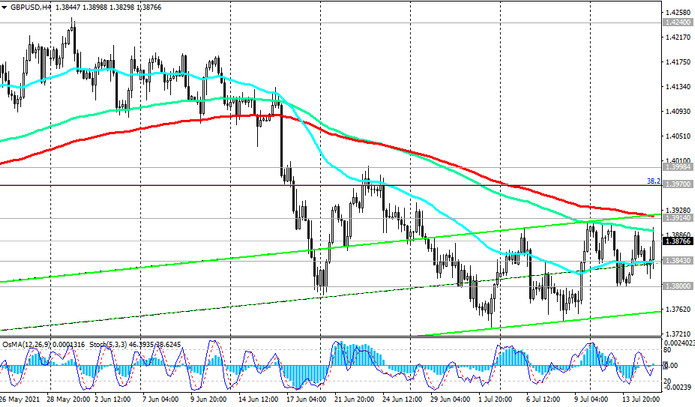
Therefore, a breakdown of the important short-term resistance level and the upper boundary of the designated range 1.3914 will be a signal for renewed buys. And an increase in the zone above the resistance levels 1.3970 (Fibonacci level 38.2% of the correction to the decline of the GBP / USD pair in the wave that began in July 2014 near the level of 1.7200), 1.4000 (local resistance level) will indicate the resumption of the GBP / USD bullish trend.

In an alternative scenario and after the breakdown of the support levels 1.3800, 1.395 GBP / USD may fall to the support levels 1.3320 (ЕМА200 on the weekly chart), 1.3210 (Fibonacci level 23.6%). Their breakdown will increase the risks of a resumption of the global bearish trend in GBP / USD and may provoke a deeper decline towards the support levels 1.2250, 1.2085, 1.2000 (Fibonacci level 0%).
Support levels: 1.3843, 1.3800, 1.3695, 1.3320, 1.3210
Resistance levels: 1.3914, 1.3970, 1.4000, 1.4100, 1.4200, 1.4240, 1.4300, 1.4350, 1.4440, 1.4580, 1.4830
Trading recommendations
Sell Stop 1.3790. Stop-Loss 1.3930. Take-Profit 1.3700, 1.3600, 1.3320, 1.3210
Buy Stop 1.3930. Stop-Loss 1.3790. Take-Profit 1.3970, 1.4000, 1.4100, 1.4200, 1.4240, 1.4300, 1.4350, 1.4440, 1.4580, 1.4830


