In mid-June, EUR / USD broke through the key long-term support level 1.1930 (ЕМА200 on the daily chart), and resumed its decline after the correction, reaching a local 13-week low at 1.1782 last Wednesday.
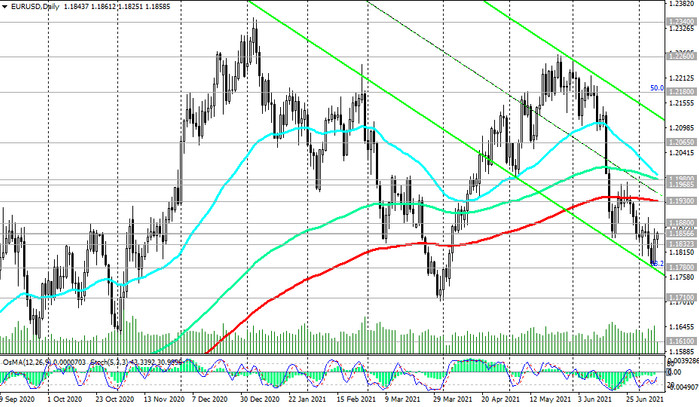
This mark is crossed by the lower line of the descending channel on the daily chart and the Fibonacci level of 38.2% of the upward correction in the wave of the pair's decline from the level of 1.3870, which began in May 2014, and the highs of 2018.
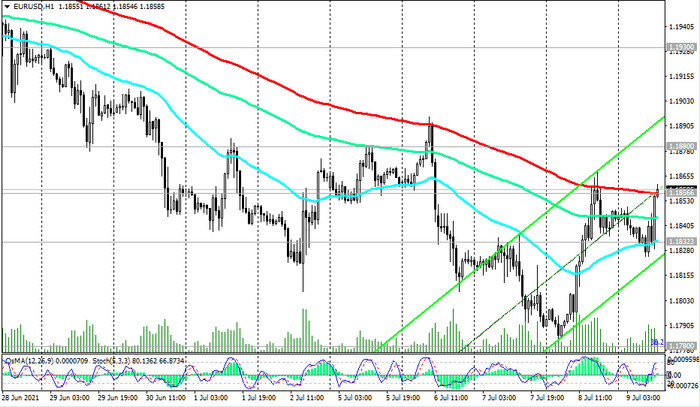
At the time of publication of this article, the EUR / USD pair was traded near the 1.1856 mark, through which an important short-term support / resistance level (ЕМА200 on the 1-hour chart) passes.

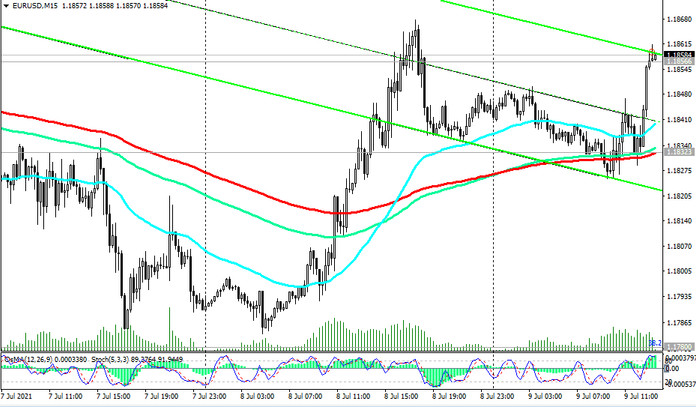
EUR / USD is in the bear market zone, and the breakdown of the short-term support level 1.1832 (ЕМА200 on the 15-minute chart) will be a signal for the pair to resume selling.
The breakout of the long-term key support level 1.1610 (ЕМА200 on the weekly chart) will finally break the EUR / USD bullish trend.
In the alternative scenario and after consolidation in the zone above the level 1.1856, further corrective growth to the resistance level 1.1930 should be expected.
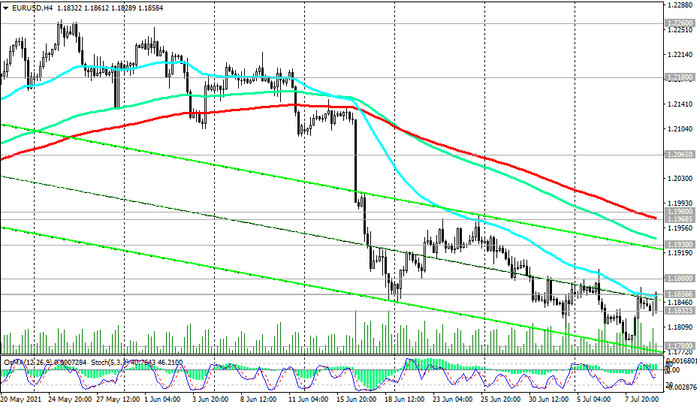
The growth of EUR / USD into the zone above the resistance levels 1.1968 (ЕМА200 on the 4-hour chart), 1.1980 (ЕМА144 on the daily chart) will become a confirmation signal for the resumption of long positions.
At least, the technical indicators OsMA and Stochastic on the 1-hour, daily charts signal the likelihood of just such a scenario, and distant growth targets are located at resistance levels 1.2260, 1.2340, 1.2450, 1.2500, 1.2580 (Fibonacci level 61.8%), 1.2600.
Support levels: 1.1832, 1.1800, 1.1780, 1.1710, 1.1610
Resistance levels: 1.1856, 1.1880, 1.1930, 1.1968, 1.1980, 1.2065, 1.2180, 1.2260, 1.2340, 1.2450, 1.2580, 1.2600
Trading Recommendations
Sell Stop 1.1830. Stop-Loss 1.1875. Take-Profit 1.1800, 1.1780, 1.1710, 1.1610
Buy Stop 1.1875. Stop-Loss 1.1830. Take-Profit 11.1930, 1.1968, 1.1980, 1.2065, 1.2180, 1.2260, 1.2340, 1.2450, 1.2580, 1.2600