

In mid-June, EUR / USD broke through the key long-term support level 1.1940 (ЕМА200 on the daily chart) and resumed its decline earlier this week after last week's correction.
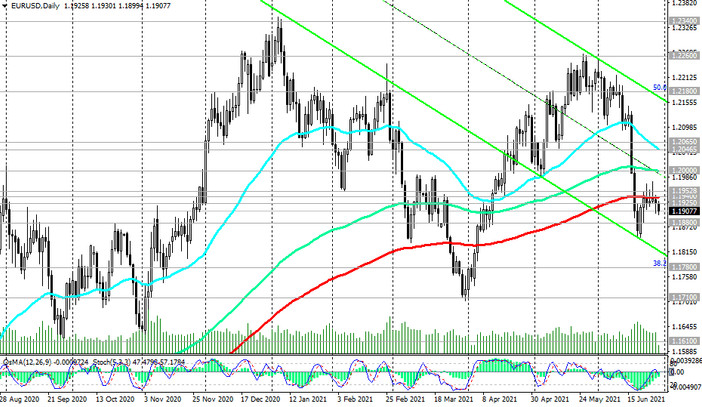
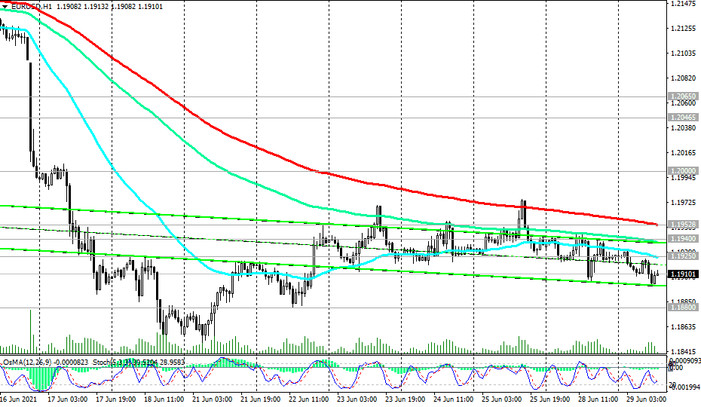
At the time of publication of this article, the EUR / USD pair was traded near the 1.1910 mark, remaining in the bear market zone.
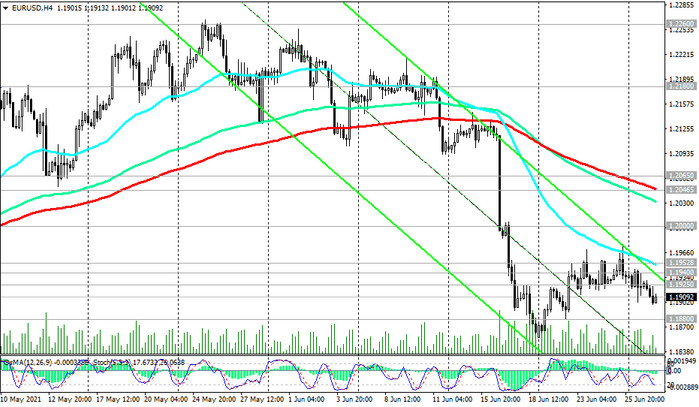
Technical indicators OsMA and Stochastic on the 1-hour, 4-hour, daily, weekly charts signal the likelihood of the continuation of the downward trend.
So far, everything speaks in favor of a further fall in EUR / USD. In case of a confirmed breakdown of the 1.1880 support level (ЕМА50 on the weekly chart), the EUR / USD decline may continue towards the 1.1780 support level (38.2% Fibonacci level of the upward correction in the wave of the pair's decline from 1.3870, which began in May 2014, and the 2018 highs year) and the local support level 1.1710 (lows of March 2021).
Break of the long-term key support level 1.1610 (ЕМА144 and ЕМА200 on the weekly chart) will finally break the bullish trend of EUR / USD.
In an alternative scenario, and after EUR / USD grows into the zone above the resistance levels 1.1940, 1.1952 (ЕМА200 on the 1-hour chart), we can talk about the resumption of the upward dynamics and the opening of long positions. And the breakdown of the resistance level 1.2000 (ЕМА144 on the daily chart) will increase the likelihood of further growth in EUR / USD.
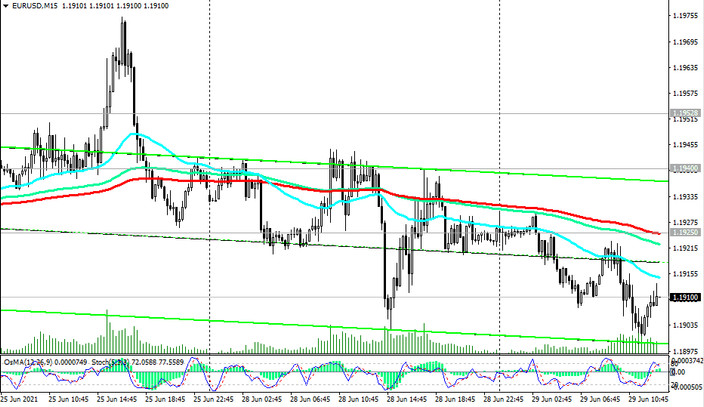
The first signal for the implementation of this alternative scenario may be a breakdown of the short-term resistance level 1.1925 (ЕМА200 on the 15-minute chart), and distant growth targets are located at resistance levels 1.2340, 1.2450, 1.2500, 1.2580 (Fibonacci level 61.8%), 1.2600.
Support levels: 1.1900, 1.1880, 1.1780, 1.1710, 1.1610
Resistance levels: 1.1925, 1.1940, 1.1952, 1.2000, 1.2046, 1.2065, 1.2180, 1.2260, 1.2340, 1.2450, 1.2580, 1.2600
Trading Recommendations
Sell Stop 1.1890. Stop-Loss 1.1930. Take-Profit 1.1880, 1.1780, 1.1710, 1.1610
Buy Stop 1.1930. Stop-Loss 1.1890. Take-Profit 1.1940, 1.1952, 1.2000, 1.2046, 1.2065, 1.2180, 1.2260, 1.2340, 1.2450, 1.2580, 1.2600


