Remaining within the ascending channel on the daily chart and in the zone above the key support levels 3875.0 (ЕМА200 on the daily chart), 3160.0 (ЕМА200 on the weekly chart), the S&P 500 maintains a long-term positive trend.
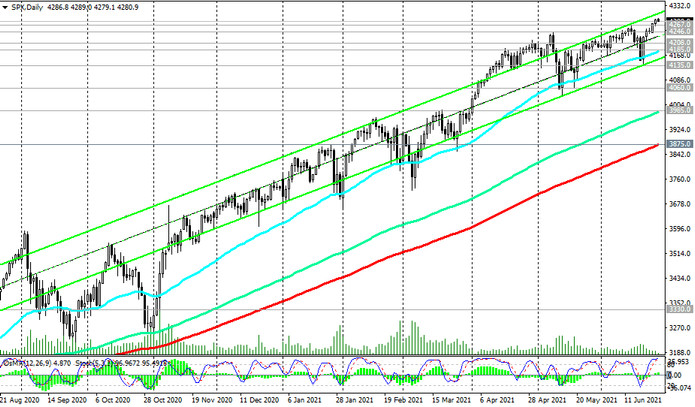
Last week, the S&P 500 was able not only to recover the losses incurred a week earlier, but also to renew record highs near 4286.0.
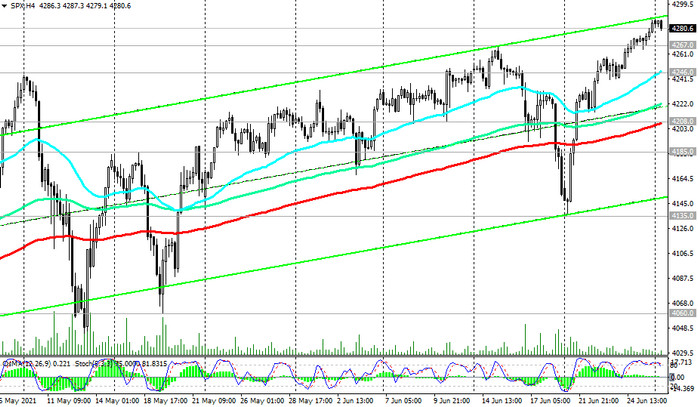
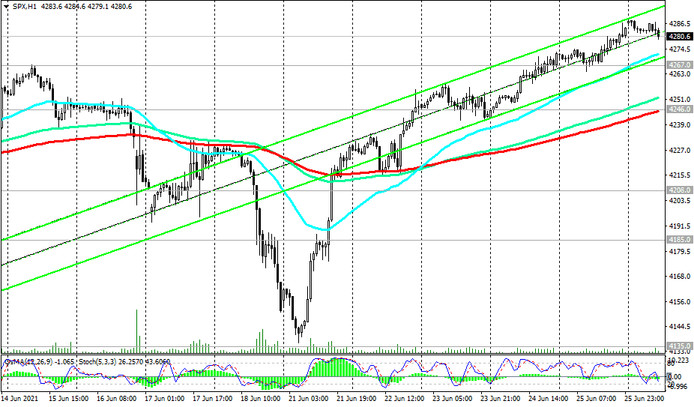
At the start of today's Asian session, S&P 500 futures are traded at this all-time high, also above the important short-term support levels 4246.0 (EMA200 on the 1-hour chart), 4208.0 (EMA200 on the 4-hour chart). So far, long positions are not threatened, and the S&P 500 seems to be aimed at new growth.

In an alternative scenario, a confirmed breakout of the support level 4185.0 will become a signal for a possibly deeper corrective decline to support levels 3985.0 (ЕМА144 on the daily chart), 3875.0 (ЕМА200 on the daily chart). The first signal for this can be a breakdown of the support level 4272.0 (ЕМА200 on the 15-minute chart).
Support levels: 4272.0, 4267.0, 4246.0, 4208.0, 4185.0, 4135.0, 4060.0, 3985.0, 3875.0
Resistance levels: 4300.0, 4335.0, 4400.0
Trading recommendations
Sell Stop 4260.0. Stop-Loss 4305.0. Targets 4246.0, 4208.0, 4185.0, 4135.0, 4060.0, 3985.0, 3875.0
Buy Stop 4305.0. Stop-Loss 4260.0. Targets 4335.0, 4400.0, 4500.0