Staying above the key support levels 0.7075 (EMA144 on the daily chart), 0.7000 (EMA200 on the daily chart), 0.6960 (EMA200 on the monthly chart), NZD / USD remains in the bull market zone.
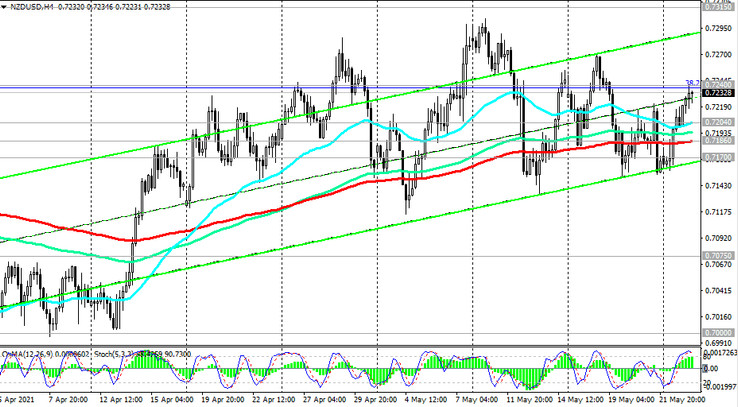
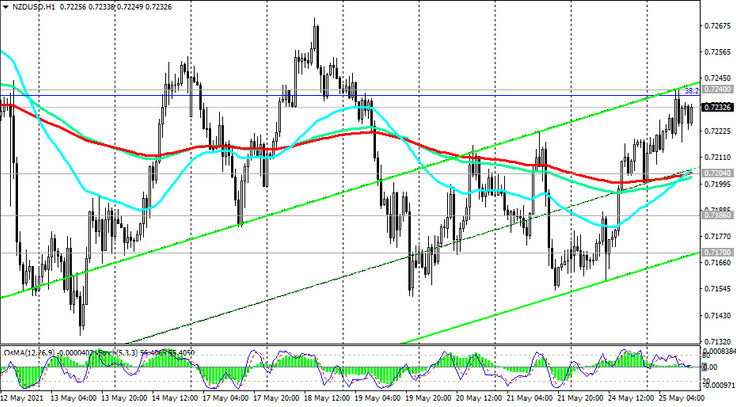
Above the short-term support levels 0.7204 (ЕМА200 on the 1-hour chart), 0.7186 (ЕМА200 on the 4-hour chart), 0.7170 (ЕМА50 on the daily chart), nothing threatens long positions.
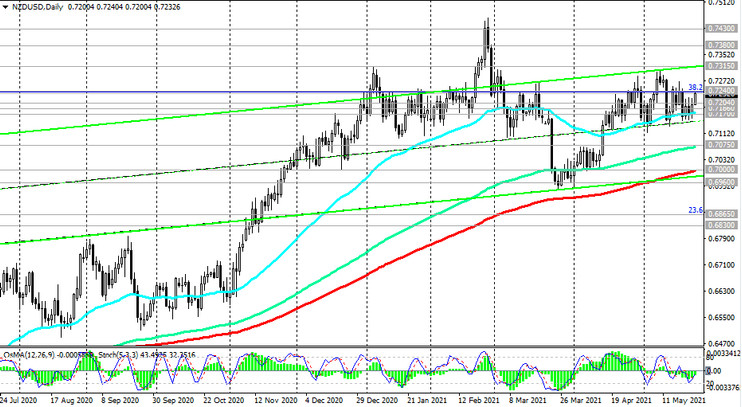
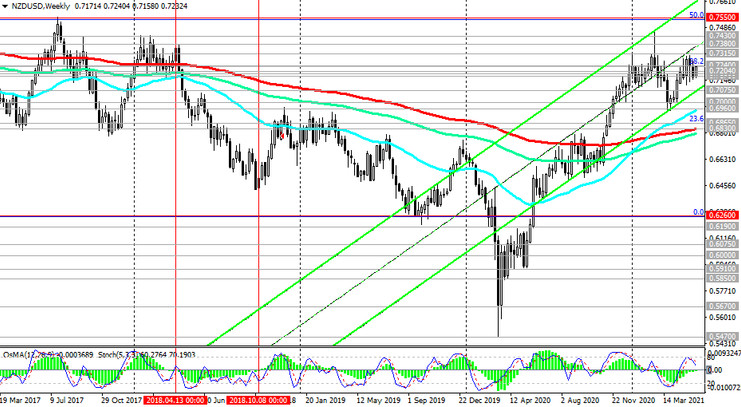
In case of breakdown into the zone above the resistance level 0.7240 (Fibonacci level 38.2% of the correction in the global wave of the pair's decline from the level of 0.8820), the growth target will be the resistance levels 0.7550 (Fibonacci level 50%), 0.7600 (the upper line of the ascending channel on the weekly chart).
In an alternative scenario, NZD / USD will resume its decline with the target at support levels 0.7075, 0.7000, 0.6960.
A breakdown of the support levels 0.6865 (Fibonacci level 23.6%), 0.6830 (ЕМА200 on the weekly chart) will increase the likelihood of a further decline in NZD / USD and its return to the global downtrend that began in July 2014.
Support levels: 0.7204, 0.7186, 0.7170, 0.7100, 0.7075, 0.7000, 0.6960, 0.6900, 0.6865, 0.6830
Resistance levels: 0.7240, 0.7315, 0.7380, 0.7430, 0.7550, 0.7600
Trading recommendations
Sell Stop 0.7195. Stop-Loss 0.7245. Take-Profit 0.7186, 0.7170, 0.7100, 0.7075, 0.7000, 0.6960, 0.6900, 0.6865, 0.6830
Buy Stop 0.7245. Stop-Loss 0.7195. Take-Profit 0.7315, 0.7380, 0.7430, 0.7550, 0.7600