
As we noted above, the price remains positive, moving in an ascending channel on the weekly chart.
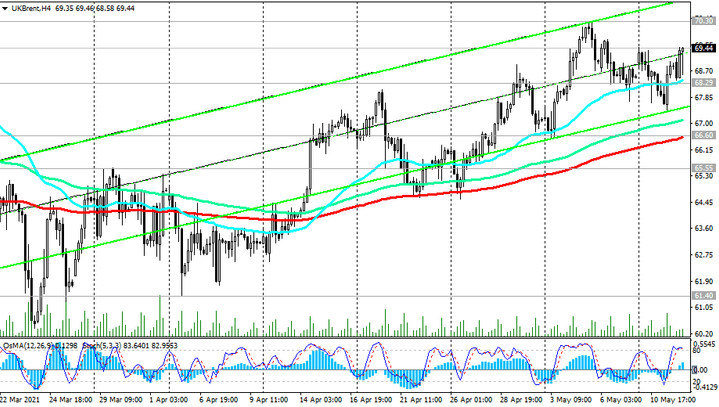
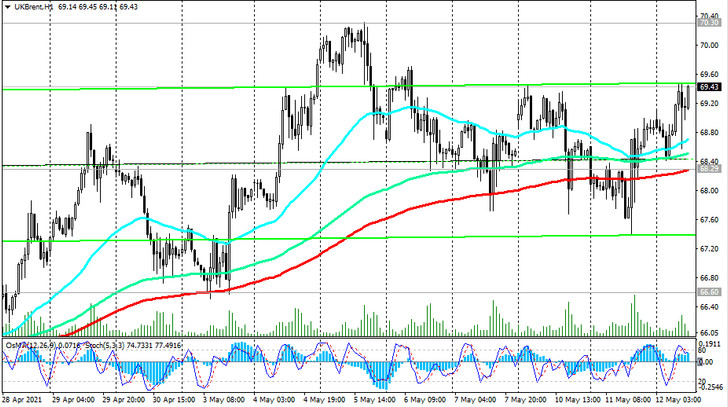
The price remains in the bull market zone and above the long-term support levels 56.60 (EMA200 on the weekly and daily charts), 59.40 (Fibonacci level 61.8%) and short-term ones 68.29 (EMA200 on the 1-hour chart) and 66.60 (EMA200 on the 4-hour chart). A breakdown of the local resistance level 70.30 will cause further price growth towards the local resistance levels 71.82, 75.50.
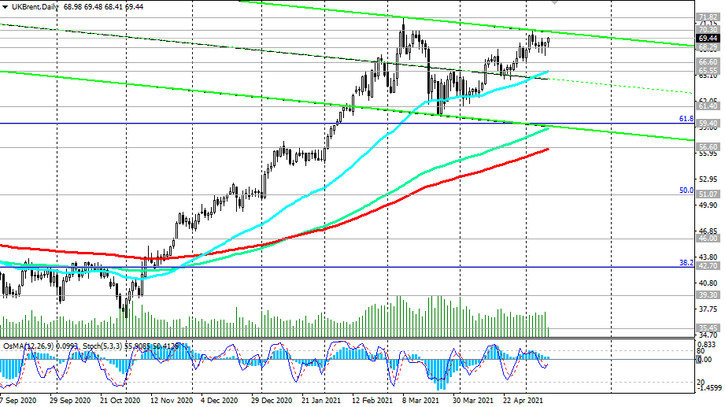
In an alternative scenario and in the event of a breakdown of the support level 65.50 (ЕМА50 on the daily chart), the decline may continue to the levels 61.40 (local lows), 59.40 (Fibonacci level 61.8% of the correction to the wave of the collapse of prices in October 2018 to almost absolute lows at 15.55 in April 2020).
The breakdown of the support level 56.60 will strengthen the negative dynamics and the likelihood of a return to the downtrend. The first signal for the implementation of this scenario will be a breakdown of the short-term important support level 68.29.
Support levels: 68.29, 66.60, 65.55, 61.40, 59.40, 56.60, 51.07
Resistance levels: 70.30, 71.82, 75.50, 86.60
Trading recommendations
Sell Stop 67.35. Stop-Loss 70.35. Take-Profit 67.00, 66.60, 65.55, 61.40, 59.40, 56.60, 51.07
Buy Stop 70.35. Stop-Loss 67.35. Take-Profit 71.00, 71.82, 75.50, 86.60


