At the beginning of today's European session, the price is testing the important resistance level of 0.7750 (the upper border of the descending channel on the daily AUD / USD chart).
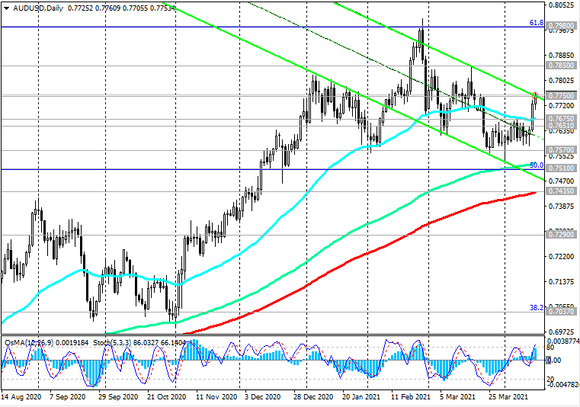
OsMA and Stochastic indicators on the daily chart are on the buyer's side.
A breakdown of this level will confirm the resumption of the upward trend in AUD / USD and direct it towards the important resistance level 0.7850 (highs in March and EMA200 on the monthly chart) with the prospect of growth towards resistance levels 0.7980 (Fibonacci level 61.8% of the correction to the wave of the pair's decline from the level 0.9500 in July 2014 to the lows of 2020 near the 0.5510 mark), 0.8160 (the upper border of the ascending channel on the weekly chart).
In an alternative scenario, the price will not be able to break through the resistance level 0.7750, and the decline in AUD / USD will resume inside the descending channel on the daily chart and to the support levels 0.7510 (50% Fibonacci level), 0.7435 (ЕМА200 on the daily chart).
A breakdown of the support level 0.7290 (ЕМА200 on the weekly chart) will finally return AUD / USD into a long-term downtrend.
Support levels: 0.7675, 0.7651, 0.7570, 0.7510, 0.7435, 0.7290
Resistance levels: 0.7750, 0.7850, 0.7980, 0.8000, 0.8160
Trading Recommendations
Sell Stop 0.7690. Stop-Loss 0.7765. Take-Profit 0.7675, 0.7651, 0.7570, 0.7510, 0.7435, 0.7290
Buy Stop 0.7765. Stop-Loss 0.7690. Take-Profit 0.7800, 0.7850, 0.7980, 0.8000, 0.8160