As we noted above, the S&P 500 maintains positive momentum, remaining in the bull market zone. Above the support levels 3948.0 (ЕМА200 on the 1-hour chart), 3906.0 (ЕМА200 on the 4-hour chart), 3885.0 (ЕМА50 on the daily chart), nothing threatens long positions.
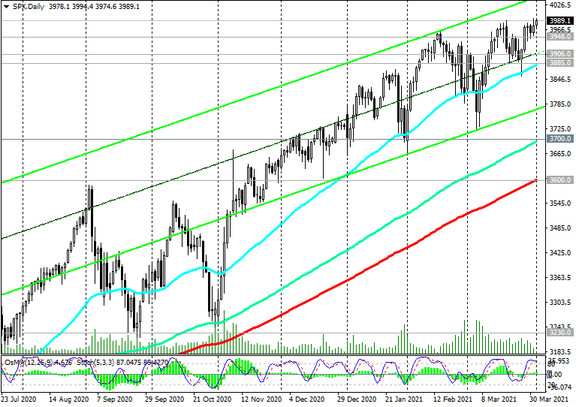
A breakdown of the local resistance level 3994.0 will confirm our forecast for further growth in the S&P 500.
In an alternative scenario, a breakdown of the 3885.0 support level will create risks for the S&P 500 to decline to the key support levels 3700.0 (ЕМА144 on the daily chart), 3600.0 (ЕМА200 on the daily chart). The first signal for the implementation of this scenario will be a breakdown of the support level 3948.0.
However, such a scenario is still unlikely. In general, the long-term bullish trend of the S&P 500 and the American stock market in general remains.
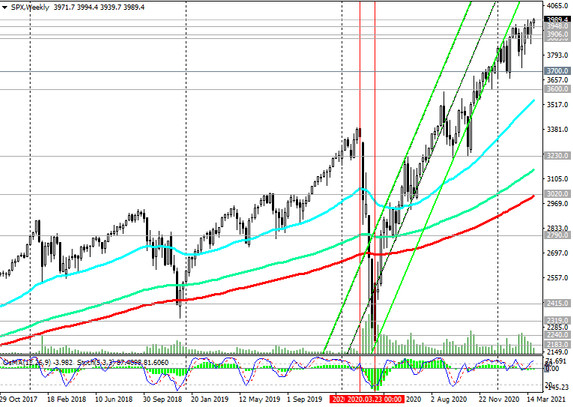
Support levels: 3948.0, 3906.0, 3885.0, 3700.0, 3600.0
Resistance levels: 3994.0, 4000.0, 4100.0
Trading recommendations
Sell Stop 3938.0. Stop-Loss 4010.0. Targets 3906.0, 3885.0, 3700.0, 3600.0
Buy Stop 4010.0. Stop-Loss 3938.0. Targets 4100.0, 4200.0