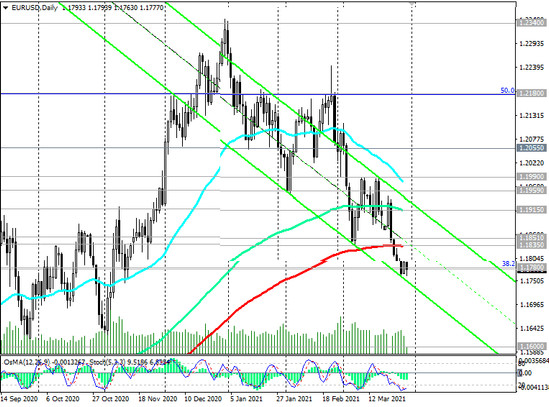
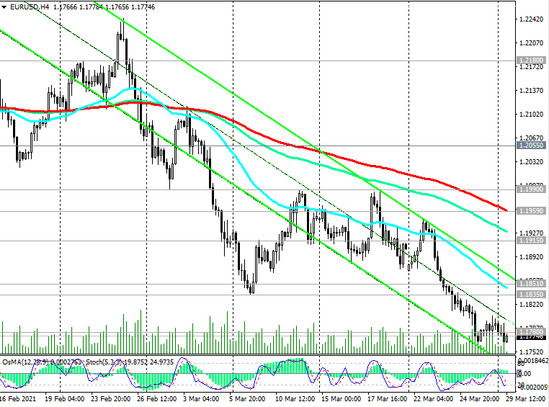
Last week, EUR / USD broke through the lower boundary of the ascending channel on the weekly chart near 1.1875 mark and the key support level 1.1835 (ЕМА200 on the daily chart).
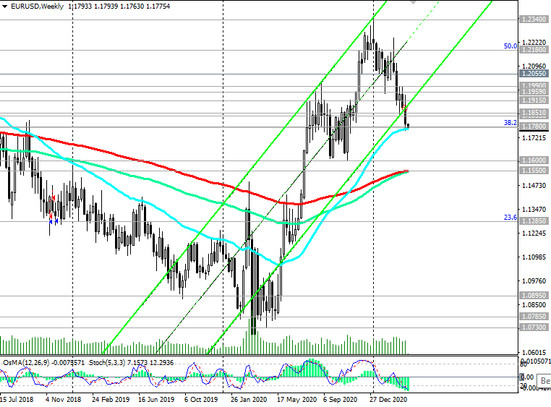
At the moment, the pair is traded at the important support level 1.1780 (EMA50 on the weekly chart and Fibonacci level 38.2% of the upward correction in the wave of the pair's decline from the level of 1.3870, which began in May 2014).
Negative dynamics prevail, and in case of a breakdown of the support level 1.1780 EUR / USD will go towards the support levels 1.1600 (local minimums and EMA50 on the monthly chart), 1.1550 (EMA200 and EMA144 on the weekly chart). The breakout of the support levels 1.1600 and 1.1550 will increase the risks of a resumption of the long-term bearish trend in EUR / USD.
In an alternative scenario and for the resumption of long positions, it is necessary to wait for the EUR / USD to rise into the zone above the resistance levels 1.1835, 1.1851 (ЕМА200 on the 1-hour chart).
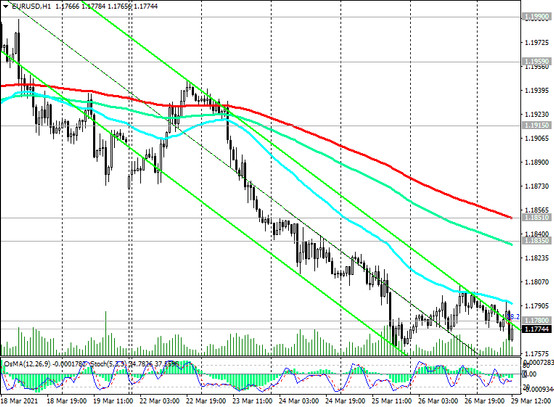
Their breakdown may open the way for growth towards the resistance levels 1.1959 (ЕМА200 on the 4-hour chart) and 1.2065 (ЕМА200 on the monthly chart).
Support Levels: 1.1780, 1.1600, 1.1550, 1.1285
Resistance Levels: 1.1835, 1.1851, 1.1915, 1.1959, 1.1990, 1.2055, 1.2070, 1.2100, 1.2180, 1.2270, 1.2340, 1.2555, 1.2580, 1.2600
Trading Recommendations
Sell Stop 1.1755. Stop-Loss 1.1855. Take-Profit 1.1700, 1.1600, 1.1550, 1.1285
Buy Stop 1.1855. Stop-Loss 1.1755. Take-Profit 1.1915, 1.1959, 1.1990, 1.2055, 1.2070, 1.2100, 1.2180, 1.2270, 1.2340, 1.2555, 1.2580, 1.2600