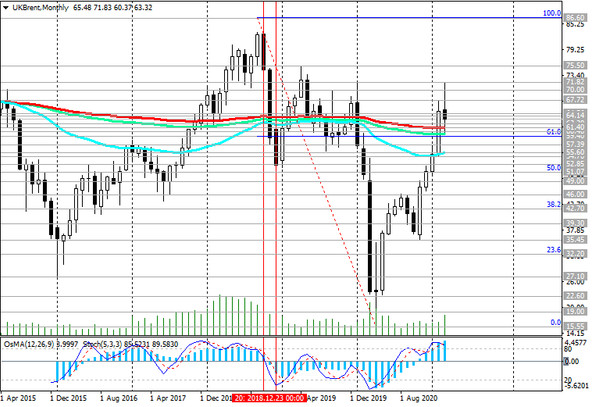
The technical picture at the moment looks contradictory. The price still maintains positive dynamics, moving in the ascending channels on the daily and weekly charts.
The price also found support at 62.20 level (ЕМА50 on the daily chart), while the technical indicators OsMA and Stochastic turned upwards on the daily chart, signaling an upward advance.
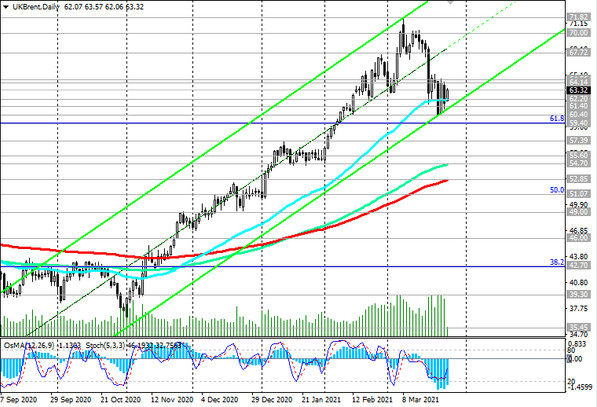
At the same time, one cannot ignore the fact that the price has broken through the important short-term support levels 64.56 (ЕМА200 on the 1-hour chart) and 64.14 (ЕМА200 on the 4-hour chart). Therefore, in the event of a breakdown of the support level 62.20, the decline may continue to the levels 60.40 (local minimums), 59.40 (Fibonacci level 61.8% of the correction to the wave of the collapse of the price in October 2018 to practically absolute minimums at 15.55 in April 2020).
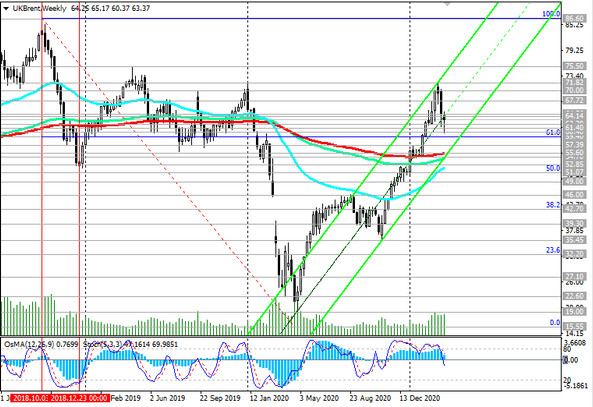
Breakdown of support levels 55.60 (ЕМА200 on the weekly chart), 52.85 (ЕМА200 on the daily chart), 51.07 (Fibonacci level 50%) will increase the negative dynamics and the likelihood of a return to the downtrend.
Support levels: 62.20, 61.40, 60.40, 59.40, 57.39, 55.60, 54.70, 52.85, 51.07
Resistance levels: 64.14, 64.56, 67.72, 70.00, 71.82, 75.50, 86.60
Trading recommendations
Sell Stop 61.90. Stop-Loss 64.60. Take-Profit 61.40, 60.40, 59.40, 57.39, 55.60, 54.70, 52.85, 51.07
Buy Stop 64.60. Stop-Loss 61.90. Take-Profit 67.72, 70.00, 71.82, 75.50, 86.60