
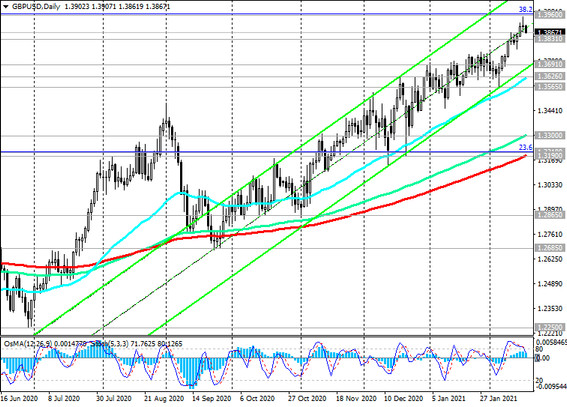
As of this writing, GBP / USD is traded near 1.3865 after hitting a fresh nearly 35-month high of 1.3950 yesterday.
GBP / USD continues to trade within the upward channels on the daily and weekly charts, generally maintaining long-term positive dynamics and staying in the zone above the important short-term 1.3691 (ЕМА200 on a 4-hour chart), 1.3831 (ЕМА200 on a 1-hour chart) and long-term 1.3190 (ЕМА200 on the daily and weekly charts) support levels.
GBP / USD is in the bull market zone and above the support levels 1.3691, 1.3831 long positions are not threatened. Growth into the zone above the resistance level 1.3960 (Fibonacci level 38.2% of the correction to the decline of the GBP / USD pair in the wave that began in July 2014 near the level of 1.7200) will just confirm the long-term bullish trend of the pair.
In an alternative scenario and after the breakdown of the support level 1.3831, the breakdown of the support level 1.3691 may provoke a decline in GBP / USD to support levels 1.3626 (ЕМА50 on the daily chart), 1.3565, and after their breakdown - to support levels 1.3300, 1.3210 (Fibonacci level 23.6%), 1.3190.
However, only a breakdown of the local support level 1.2685 (September lows) will increase the risks of a resumption of the global bearish trend in GBP / USD and may provoke a deeper decline towards support levels 1.2250, 1.2085, 1.2000 (Fibonacci level 0%).
Support levels: 1.3831, 1.3691, 1.3626, 1.3565, 1.3300, 1.3210, 1.3190
Resistance levels: 1.3960, 1.4000, 1.4350
Trading recommendations
Sell Stop 1.3825. Stop-Loss 1.3915. Take-Profit 1.3800, 1.3690, 1.3630, 1.3565, 1.3300, 1.3210, 1.3190
Buy Stop 1.3915. Stop-Loss 1.3825. Take-Profit 1.3960, 1.4000, 1.4100


