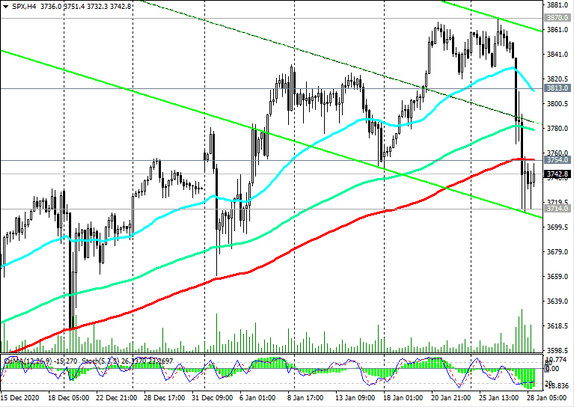
Having reached the local minimum and the support level 3714.0 (ЕМА50 and the lower border of the ascending channel on the daily chart) on Wednesday, S&P 500 futures are traded near 3745.0 at the beginning of today's European session, trying to recover losses and continue to grow.
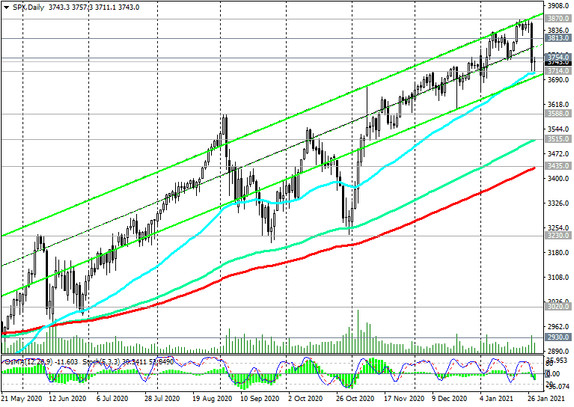
In general, and above the key support levels 3397.0 (highs on the eve of the fall in February 2020), 3435.0 (ЕМА200 on the daily chart), the long-term positive dynamics of the S&P 500 remains.
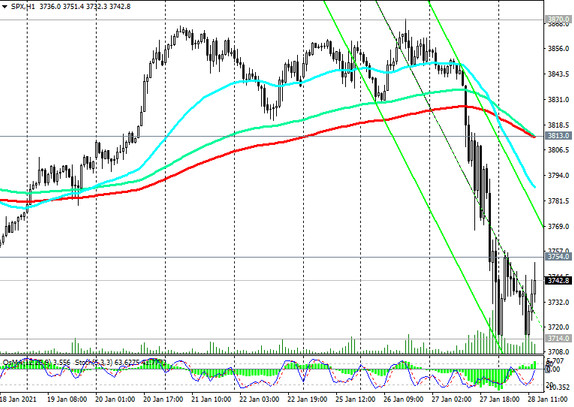
The growth of the index is most likely to resume. The first signal for this will be a breakdown of the resistance level 3754.0 (ЕМА200 on the 4-hour chart). A return into the zone above the resistance level 3813.0 (ЕМА200 on the 1-hour chart) will confirm the recovery of the upward dynamics of the S&P 500.
In an alternative scenario, the decline in the S&P 500 after the breakdown of support level 3714.0 will continue, which will increase the risks of further falling towards support levels 3397.0 (highs in the previous wave of growth since February 2016 and 1807.0 mark), 3515.0, 3435.0 and further towards support level 3230.0 (lows September, October, November), below which short positions will become relevant again.
The breakout of the support level 2930.0 (ЕМА200 on the weekly chart) will finally reverse the bullish trend of the S&P 500.
Support levels: 3714.0, 3588.0, 3515.0, 3435.0, 3448.0, 3300.0, 3230.0
Resistance levels: 3754.0, 3813.0, 3870.0, 3900.0
Trading recommendations
Sell Stop 3712.0. Stop-Loss 3760.0. Targets 3700.0, 3600.0, 3588.0, 3515.0, 3435.0, 3448.0, 3300.0, 3230.0
Buy by market. Buy Stop 3760.0. Stop-Loss 3712.0. Targets 3813.0, 3870.0, 3900.0