
Divergence setups generally compare price extremes such as the peaks of price to the peaks of a chosen oscillator and signaled when moving in a different direction, helping the trader identify market reversal and continuation zones.
In this post, we'll be considering the Regular Divergence setups.
Regular divergence setups help the trader time trend reversal and if used correctly, can yield highly profitable returns.
They are popular in the FX markets and have also been consistent in the cryptocurrency market.
Description
Regular divergence setups involve a comparison of the extreme levels (Peaks or Valleys) of price to extreme levels (Peaks or Valleys) of your chosen oscillator. The oscillators, in this case, can be any of the popular ones like Relative Strength Index (RSI), MACD, CCI, Stochastic, etc.
Considering that markets move in either the bullish or bearish direction, regular divergence patterns are of the bullish and bearish variants. These are known as the regular bullish divergence and the regular bearish divergence setups.
Regular Bullish Divergence
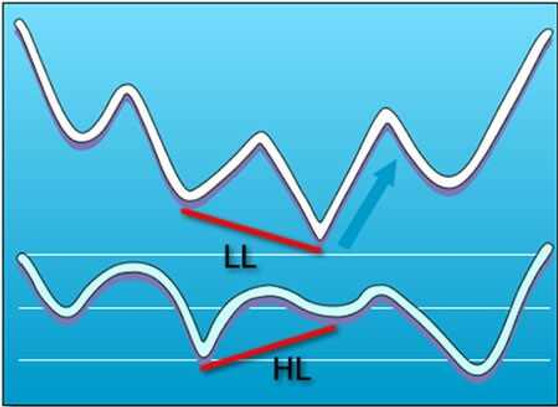
A Regular bullish divergence occurs at the end of a bearish or downhill trend, where the price makes lower lows (LL) compared to the oscillators' higher lows (HL).
Let us consider the price and oscillators' point A and Point B, where each point signifies the lows of the price and oscillator.
The analyzed chart has to meet the following conditions to confirm it as a regular bullish divergence:
Where point B is the current low, and Point A is the previous low.
- At point B, the price makes a lower low (trough) compared to the oscillators' higher low.
- At point A, the price makes a higher low (trough) compared to the oscillators' low, as shown in the image.
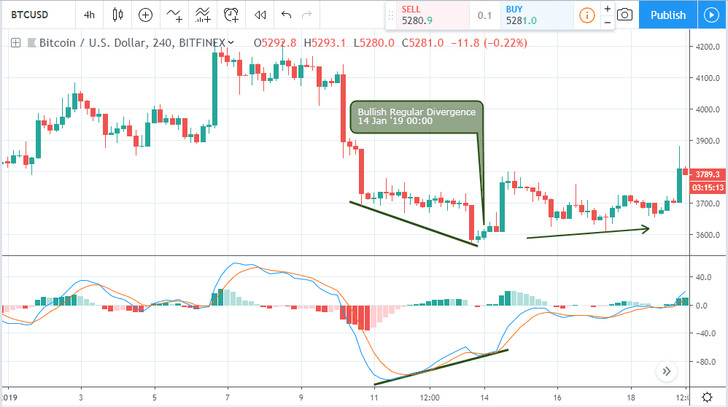
Below is a quick demonstration of the regular bullish divergence setup on a live chart, followed by entry and exit rules.
BTCUSD Four Hour Time Frame Regular Bullish Divergence
Regular Bullish Divergence - Entry and Exit Conditions (Stop Loss, Take Profit)
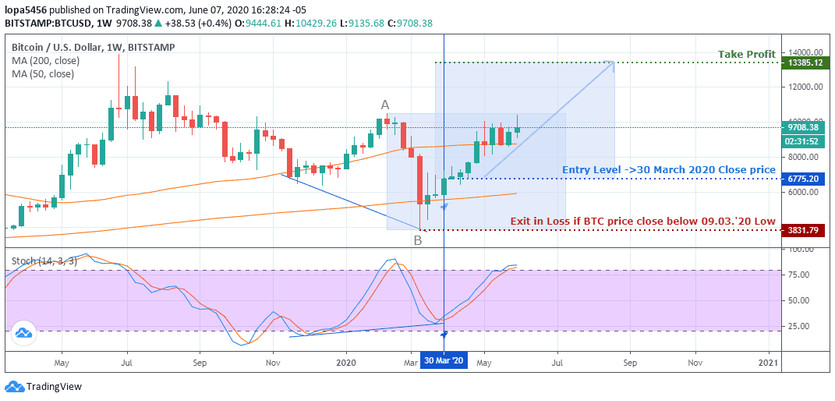
Entry Level:
The above weekly chart illustration shows a regular bullish divergence signaling a bullish directional bias.
A buy order is signaled at the opening price ($6775.2) of the candlestick after the golden cross of the stochastic oscillator (when the blue line crosses above the red line).
Exit in Loss
Exits in loss can be done in two different ways.
First is via a Stop Loss, which is a fixed price target.
Second is via a price close below a significant support level in the case of a bullish divergence.
Exit by Stop Loss:
The stop-loss price level from the above weekly chart is placed at a distance (-30%) from the significant support ($3831.79).
Exit by Price Close below Significant support
The buy order from a divergence setup is automatically closed if a candlestick from the same time frame that signaled the divergence closes below the significant support (e.g., $3831.79).
Exit by Take Profit
Take profit is a fixed price level established by using a rectangle object to mark the range A-B, as shown in the image above.
We then duplicate the rectangle by holding down control on the keyboard and move its base to the trades' opening price.
The height of the rectangle marks the take profit at $13385.12.
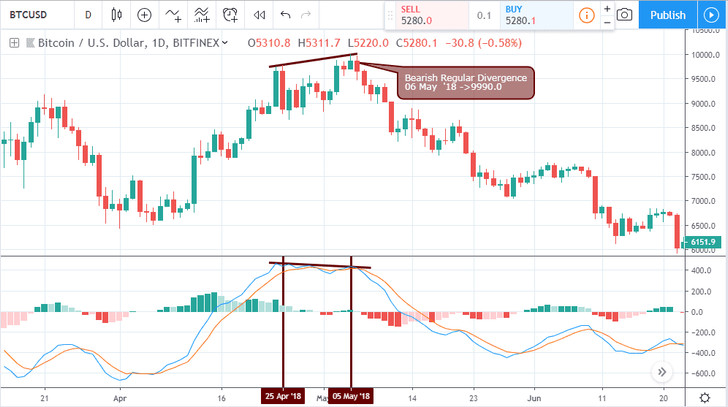
Regular Bearish Divergence
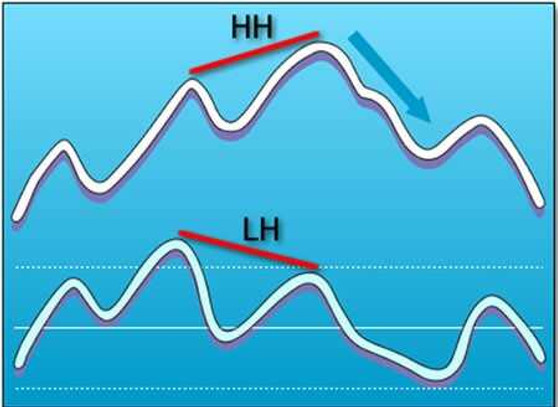
For a regular bearish divergence, in a bullish trend, the current high of the price makes a higher high (HH), compared to the oscillators lower high (LH).
A dead cross of the oscillator generally confirms the price reversal in the opposite direction.
Below is a quick demonstration of the regular bearish divergence setup on a live chart, followed by entry and exit rules.
BTCUSD Daily Time Frame Regular Bearish Divergence
Regular Bearish Divergence - Entry and Exit Conditions (Stop Loss, Take Profit)
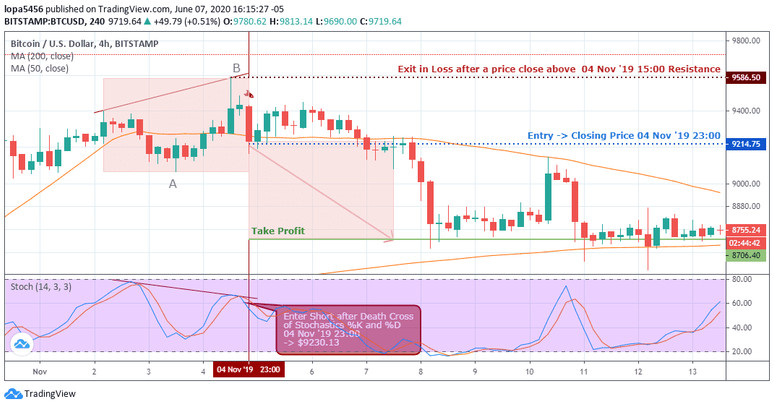
Entry Level:
The above weekly chart illustration shows a regular bearish divergence signaling a bearish directional bias.
A sell order is signaled at the opening price ($9214.75) of the candlestick after the death cross of the stochastic oscillator (when the blue line is below the red line).
Exit in Loss
Exits in loss can be done in two different ways.
First is via a Stop Loss, which is a fixed price target.
Second is via a price close above a significant resistance level in the case of a bearish divergence.
Exit by Stop Loss:
The stop-loss price level from the above 4hour chart is placed at a distance (3%) from the significant resistance.
Exit by Price Close below Significant support
The buy order from a bearish divergence setup is automatically closed if a candlestick from the same time frame (e.g., 4hour) that signaled the divergence closes below the significant resistance (e.g., $9586.50 from the chart above).
Exit by Take Profit
Take profit is a fixed price level established by using a rectangle object to mark the range A-B, as shown in the image above.
We then duplicate the rectangle by holding down control on the keyboard and moving its base to the trade's opening price.
The base of the rectangle marks the take profit at $8706.4.
Conclusion and Suggestions
Traders can better optimize the results from regular divergence patterns by using them in combination with candlestick price action patterns and trend-based indicators like the ADX and Heiken Ashi candlesticks.