USD Fundamentals: Dollar Weakness Extends as Market Remains Fixated on “Fed Pivot” Story
The US dollar is weaker again in what now seems like a strongly determined market to short the dollar no matter the specifics of day-to-day news. For instance, last week’s CPI report was close to the forecasts, and the market reaction was still bearish USD. The driver was a further reduction of Fed rate hike expectations, with the market now expecting only a 25bp rate hike at the next meeting, down from a 50bp hike two weeks ago. In effect, this additional pricing out of Fed rate hikes is the reason for the further USD decline last week.
This week’s calendar is much lighter, which could help stabilize the Fx market a little, particularly now as traders will begin focusing on the Fed meeting in two weeks. The fact that the Fed is still “priced in” to deliver two more 25bp rate hikes is a reminder that the “hawkish mode” may be toning down but is still on. This could help to provide some much-needed stabilization to the embattled USD now.
The PPI inflation, retail sales, and the Empire State manufacturing reports will be in focus, as well as several Fed speakers throughout the week. Perhaps Fed speakers could potentially move the market the most. The key question is whether they confirm the slowing to 25bp hikes or protest against it. Philadelphia Fed President Harker last week already spoke in favor of slowing to 25bp hikes, and the dollar accelerated the move down as a result.
Positioning is another factor to keep an eye on. In the summer and autumn months, “long USD” was a very stretched position. The recent sharp USD correction has reduced that to a great extent, with Fx positioning now being much more USD neutral. This could mean that further USD losses may not come so easily.
EUR Fundamentals: EUR-Optimism Grows Further
The euro continues its run higher and last week also expanded the rally with a big move higher in EURCHF. EURJPY was the only of the major EUR pairs that closed the week lower, but that is mostly driven by bullish JPY fundamentals (more in the JPY section below).
The main factors behind the big euro rally in recent months are connected to the hawkish “ECB pivot” and the (for now) less severe economic damage to Europe from the energy and electricity crisis. The markets are even entering a broad optimism phase about Europe (what we call EUR-Optimism) to the point that it almost feels like there is no energy crisis and war in Ukraine. News from China about an end to Covid restrictions there and a gradual re-opening of the economy also add to the positive risk appetite mood and support the euro via the close EU-China trade relationship (China optimism benefits the euro).
At the moment, the bullish EUR sentiment is fully in the driving seat, and it’s hard to fight this trend. However, is the EUR-optimism sustainable? The war in Ukraine is still raging, and energy prices in Europe are still at least 2-3 times the average from before the Russia-Ukraine war. Will this reality come to eventually “bite the euro” again, or is the worst over for Europe? Those are some of the key questions the market will look to answer in the coming months, with big implications for the EUR exchange rate.
The Eurozone calendar features the German ZEW economic sentiment index and the ECB monetary policy meeting accounts (minutes). ECB speakers like President Lagarde will also get attention in the markets.
EURUSD Technical Analysis:
It’s time to look at the monthly EURUSD chart again to highlight the importance of the current juncture on the charts.
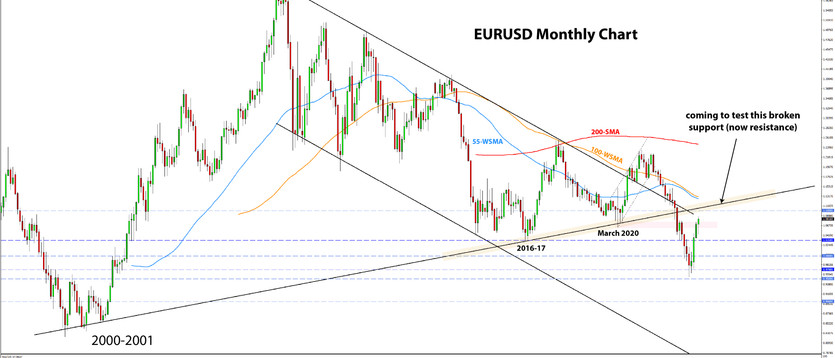
EURUSD (same with the broad DXY index) is at a big inflexion point, hitting a multi-month and multi-year resistance area at 1.08 - 1.10. This zone on the charts is a defining point for the big EURUSD bear trend that started last year. For instance, this is where the Covid lows from March 2020 and multiple other past lows are located.
The bearish break below the 1.08 - 1.10 area last June was a significant event, and as long as EURUSD trades under it, the long-term technical bias will stay bearish. The current bullish move is a major challenge to the resistance here. Some reaction looks increasingly likely here when we consider that EURUSD is already at overbought levels on lower timeframes (weekly, daily).
A break above 1.08 - 1.10 sometime this year would indicate that last year’s breakout below it was “fake”. On the other hand, if 1.08 - 1.10 holds as resistance, EURUSD returning back toward parity will remain a live scenario.
GBP Fundamentals: Busy Schedule on UK Calendar
The risk-sensitive GBP has remained well supported in the current global market trends of “soft dollar” and a sanguine risk appetite mood. However, the big question is whether this positive global environment will continue or could be about to turn? We are likely to find that out soon, and GBP should trade accordingly.
The week ahead is very busy on the UK calendar. It features employment reports, CPI inflation and retail sales. Yet, no matter how the data comes out, global risk sentiment is likely to stay as the bigger driver for GBP (although the calendar events can certainly cause volatility).
Regarding the risk sentiment, we are likely to see a big move down in GBP if stocks reverse and fall. This would come in tandem with other risk-sensitive currencies falling (like AUD, CAD, and NZD). The massive monetary tightening via rate hikes and QT from nearly all central banks in the past 6-12 months suggests that a major upside move in stocks is unlikely. Thus, a reversion down for stocks still seems more probable than a big bullish breakout. And the same holds for GBPUSD.
GBPUSD Technical Analysis:
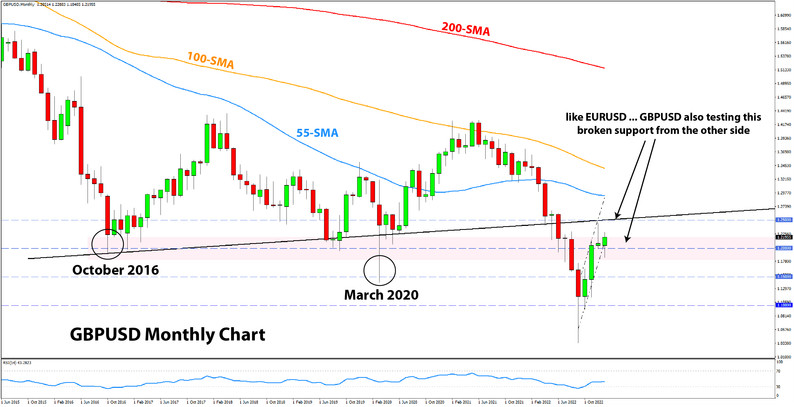
Continuing with monthly charts this week, GBPUSD is at a similarly important long-term inflexion point.
The 1.20 area as a wider technical zone is far from broken. It represents significant lows from the 2016 Brexit crisis and the March 2020 Covid crisis. Similarly to EURUSD, it was broken down in 2022, and GBPUSD is now testing it from the other side.
The key question is, will 1.20 hold as a broader resistance area here? If it does hold, then GBPUSD falling to the 1.15 area still seems like a decently probable scenario. On the other hand, a bullish breakout here would potentially have significant upside implications, with GBPUSD levels of 1.40 or higher becoming possible again.
JPY Fundamentals: All Eyes on BOJ Meeting: Building Speculation for a Further Widening of the YCC 50bp Limit
The Japanese yen remains firm in an environment of a generally softening dollar and hawkish BOJ sentiment following the December hawkish adjustment of the YCC policy
There is now increasing speculation in the Fx market that the BOJ will need to make another hawkish adjustment soon to widen the YYC band by a further 50bp from 0.50% to 1.00%. The upward pressure in the Japanese bond market is increasing and is likely to force the BOJ to this move. This would again be bullish for JPY as it basically acts as a rate hike (although it is not).
USDJPY could drop further toward 125.00 this week in the event of a hawkish BOJ decision. On the other hand, a return above 130.00 would be the scenario if the BOJ disappoints hawkish expectations.
USDJPY Technical Analysis:
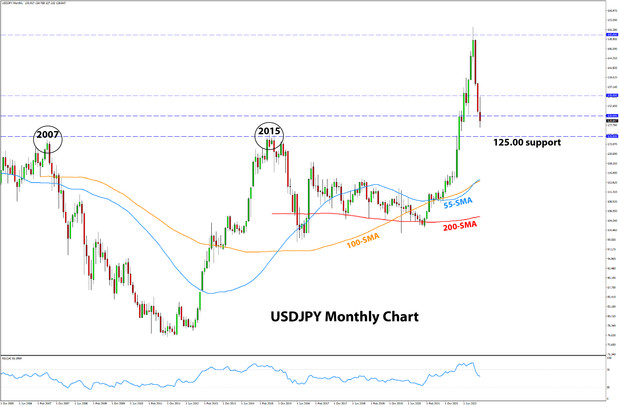
The monthly USDJPY chart is also near a technical area of multi-year significance, around 125.00. It is where USDJPY peaked in 2007 and 2015. This tough resistance was broken in April 2022, and now is the first time since the summer that USDJPY is coming back to it. Now, it will act as support.
The monthly chart shows a classic “breakout-retracement-retest” behaviour in USDJPY currently. If the retest of the 125.00 area from the other side is successful, then the lows of the steep decline may soon be put in place.
Such retests of previously broken technical zones usually result in continuation in the direction of the major trend (up in this case). For USDJPY, this would mean a bullish return above 130.00 and likely also above 135.00 over the coming months.
On the other hand, in the bearish scenario, USDJPY would break below the 125.00 big support area. In this case, a further fast decline toward 115.00 and 110.00 would become the more likely outcome.